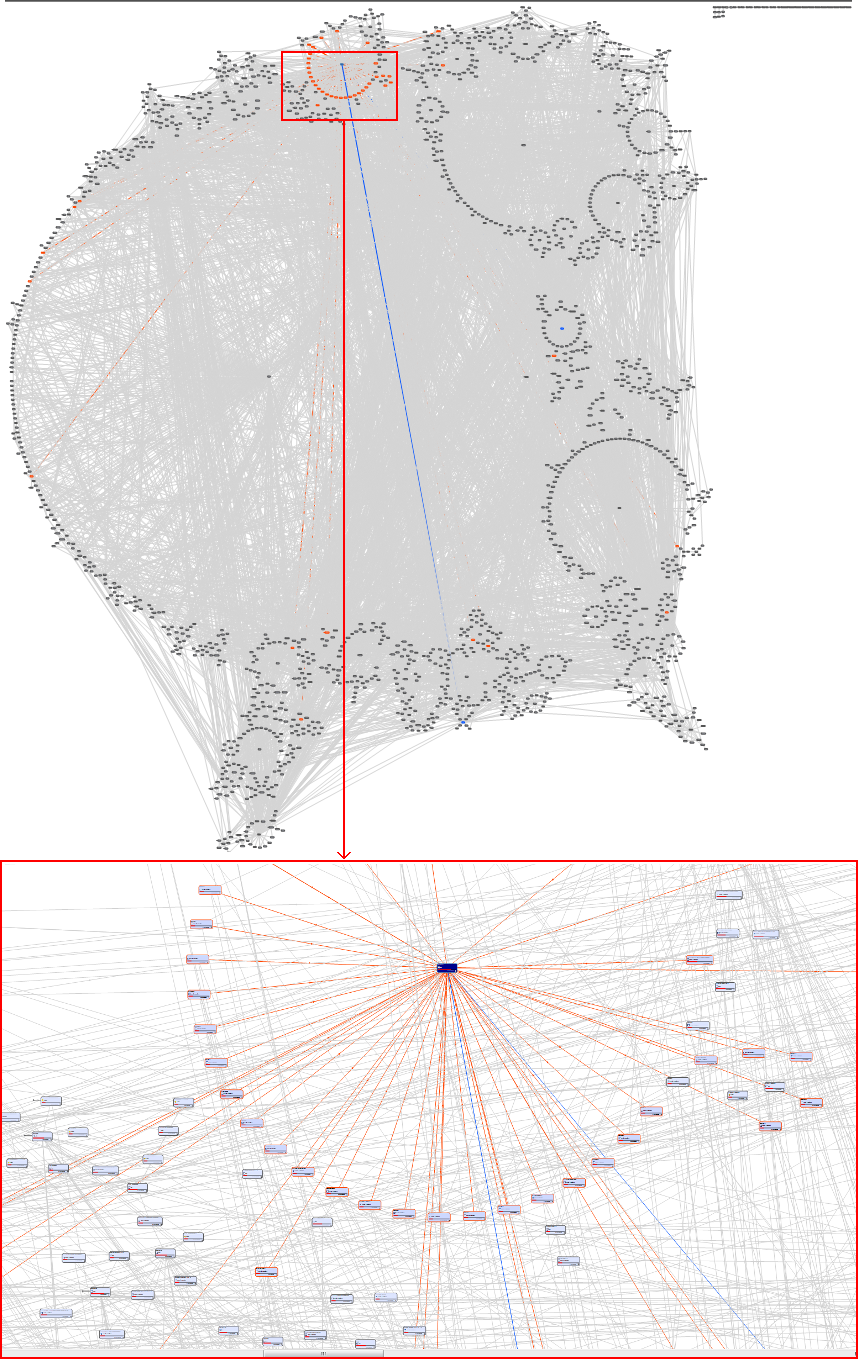
A truly complex (in the mathematical sense) dependency graph
Posted: Thu Apr 26, 2018 9:06 am
This thing is utterly terrifying.

(Sorry about how big it is. Apparently, this version of PHPBB is too old to support image size limits - a feature introduced more than ten years ago...)
How do you get a dependency graph so complicated that it displays both a high fractional dimension and significant self-similarity? You know what, forget it, I don't want to know...
Apparently, this is an extreme example of softcoding gone mad:
The final paragraph is pretty awful, too:Remy Porter wrote:What you’re seeing here is the relationship between stored procedures and tables. Circa 1995, when this application shambled into something resembling life, the thinking was, “If we put all the business logic in stored procedures, it’ll be easy to slap new GUIs on there as technology changes!”
I feel nauseated just reading that...Remy Porter wrote:By the time Thomas [a new developer on the project, and the person who submitted the story to The Daily WTF] came along to start a pseudo-greenfield GUI in ASP.Net, the first and simplest feature he needed to implement involved calling a 3,000 line stored procedure which required over 100 parameters.