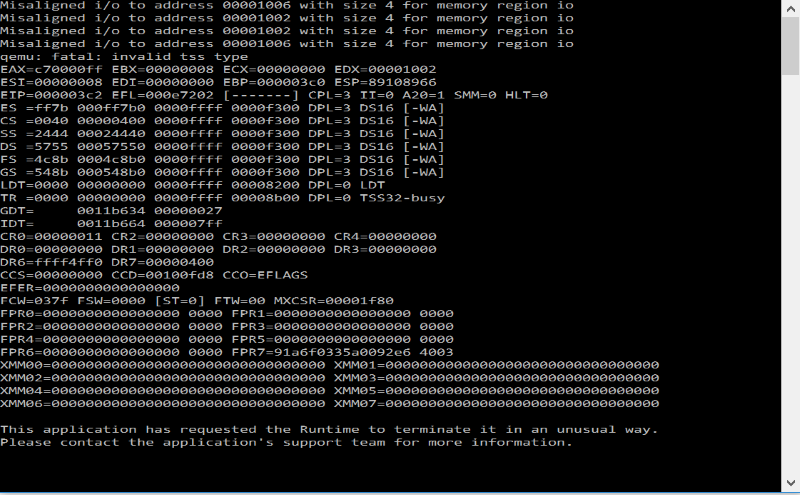
I had nothing meaningful to say at this point, so I went as far as to debug the kernel for a while. But note that debugging is the better virtue of understanding (exactly the opposite philosophy of Linus Torvalds here.)
The problem turned out to be that the inline assembly in TaskManager::register_task messes up the flags. This function is using esp based local variable references in O2, which means that the assembly gets its output operand in form relative to the stack pointer, which it also modifies. As a result, the eflags is incorrect and gets TF set, which on the first context switch results in ISR1 on the leading task instruction. This does not happen on O0. The solution I used was to define the function as:
Code: Select all
int __attribute__((optimize("-fno-omit-frame-pointer"))) TaskManager::register_task(task_func_t task)
, which guarantees that rbp will be used to refer to local variables no matter what the optimization level.
For future reference, to debug the project, add "-g3" to all build commands in make.bat except the linker. Add the following at the end of the linker script (as per the default linker script):
Code: Select all
	end = .;

  /* Stabs debugging sections.  */
  .stab          0 : { *(.stab) }
  .stabstr       0 : { *(.stabstr) }
  .stab.excl     0 : { *(.stab.excl) }
  .stab.exclstr  0 : { *(.stab.exclstr) }
  .stab.index    0 : { *(.stab.index) }
  .stab.indexstr 0 : { *(.stab.indexstr) }
  .comment       0 : { *(.comment) }
  /* DWARF debug sections.
     Symbols in the DWARF debugging sections are relative to the beginning
     of the section so we begin them at 0.  */
  /* DWARF 1 */
  .debug          0 : { *(.debug) }
  .line           0 : { *(.line) }
  /* GNU DWARF 1 extensions */
  .debug_srcinfo  0 : { *(.debug_srcinfo) }
  .debug_sfnames  0 : { *(.debug_sfnames) }
  /* DWARF 1.1 and DWARF 2 */
  .debug_aranges  0 : { *(.debug_aranges) }
  .debug_pubnames 0 : { *(.debug_pubnames) }
  /* DWARF 2 */
  .debug_info     0 : { *(.debug_info .gnu.linkonce.wi.*) }
  .debug_abbrev   0 : { *(.debug_abbrev) }
  .debug_line     0 : { *(.debug_line .debug_line.* .debug_line_end ) }
  .debug_frame    0 : { *(.debug_frame) }
  .debug_str      0 : { *(.debug_str) }
  .debug_loc      0 : { *(.debug_loc) }
  .debug_macinfo  0 : { *(.debug_macinfo) }
  /* SGI/MIPS DWARF 2 extensions */
  .debug_weaknames 0 : { *(.debug_weaknames) }
  .debug_funcnames 0 : { *(.debug_funcnames) }
  .debug_typenames 0 : { *(.debug_typenames) }
  .debug_varnames  0 : { *(.debug_varnames) }
  /* DWARF 3 */
  .debug_pubtypes 0 : { *(.debug_pubtypes) }
  .debug_ranges   0 : { *(.debug_ranges) }
  /* DWARF Extension.  */
  .debug_macro    0 : { *(.debug_macro) }
  .debug_addr     0 : { *(.debug_addr) }
}
After the linker command, run the following:
Code: Select all
i686-elf-objcopy --only-keep-debug ../kernel.bin ../kernel.sym
i686-elf-objcopy --strip-debug ../kernel.bin
And start the debugger as such:
Code: Select all
start i686-elf-tools-windows\bin\i686-elf-gdb.exe -s kernel.sym -ex "target remote | ./qemu/qemu-system-i386 -S -gdb stdio -kernel kernel.bin"
Your gdb build has no tui mode or you would be able to watch the source in a separate pane with highlight on the current line. But you can still set breakpoints and step over, view the stack, etc. Also, I would compile with "-O0" or at least "-Og" for a while. (The bug manifested at "Og" as well.)
Use the monitor commands to view debug registers and state that gdb does not support natively. (For example, "monitor info registers".)
Edit: One last note. Use the type assembly directive to produce proper function symbols from gas files. As in ".type isr\id, @function"


